
Know Exactly Where Your School's Money Goes — In Real Time
Fee collection dashboards, debtor reports, income breakdowns by subscription, term-over-term comparisons, audit reports, and PDF exports — every number your bursar, accountant, or school board needs, always live, never stale.
17+
Report views
Real-time
Every dashboard is live
PDF
Export any report instantly
Report types
Six Reports That Cover Every Financial Question
From daily collection snapshots to end-of-term audit packages — every report is live, filterable by session and term, and exportable as PDF.
Dashboard Overview
High-level KPIs: total income, total outstanding, collection rate, student count, and transaction volume — filtered by session and term. The first thing you see when you log in.
Finance Reports
Income per subscription, outstanding per term, income vs voucher comparison, and termly income trends across the full academic session. See exactly where your money comes from.
Debtor Reports
Outstanding by class, by subscription, by student. Full debtor lists with last payment date. Export to PDF — filtered by term, session, or class. The report your board asks for every meeting.
Business Reports
Income breakdown across subscriptions and products, payroll expense summaries, revenue linkage performance, salary distribution by employee group, and payroll gap analysis.
Audit Reports
Total inflow vs expenses, transaction linking statistics, reconciliation status breakdown, and term-over-term financial comparison — everything your auditor or accountant needs in one view.
Growth Reports
Student enrolment trends, new registrations per term, and retention rates — track how your school is growing over time. Compare sessions and spot patterns early.
Trend Analysis
See Trends Before They Become Problems
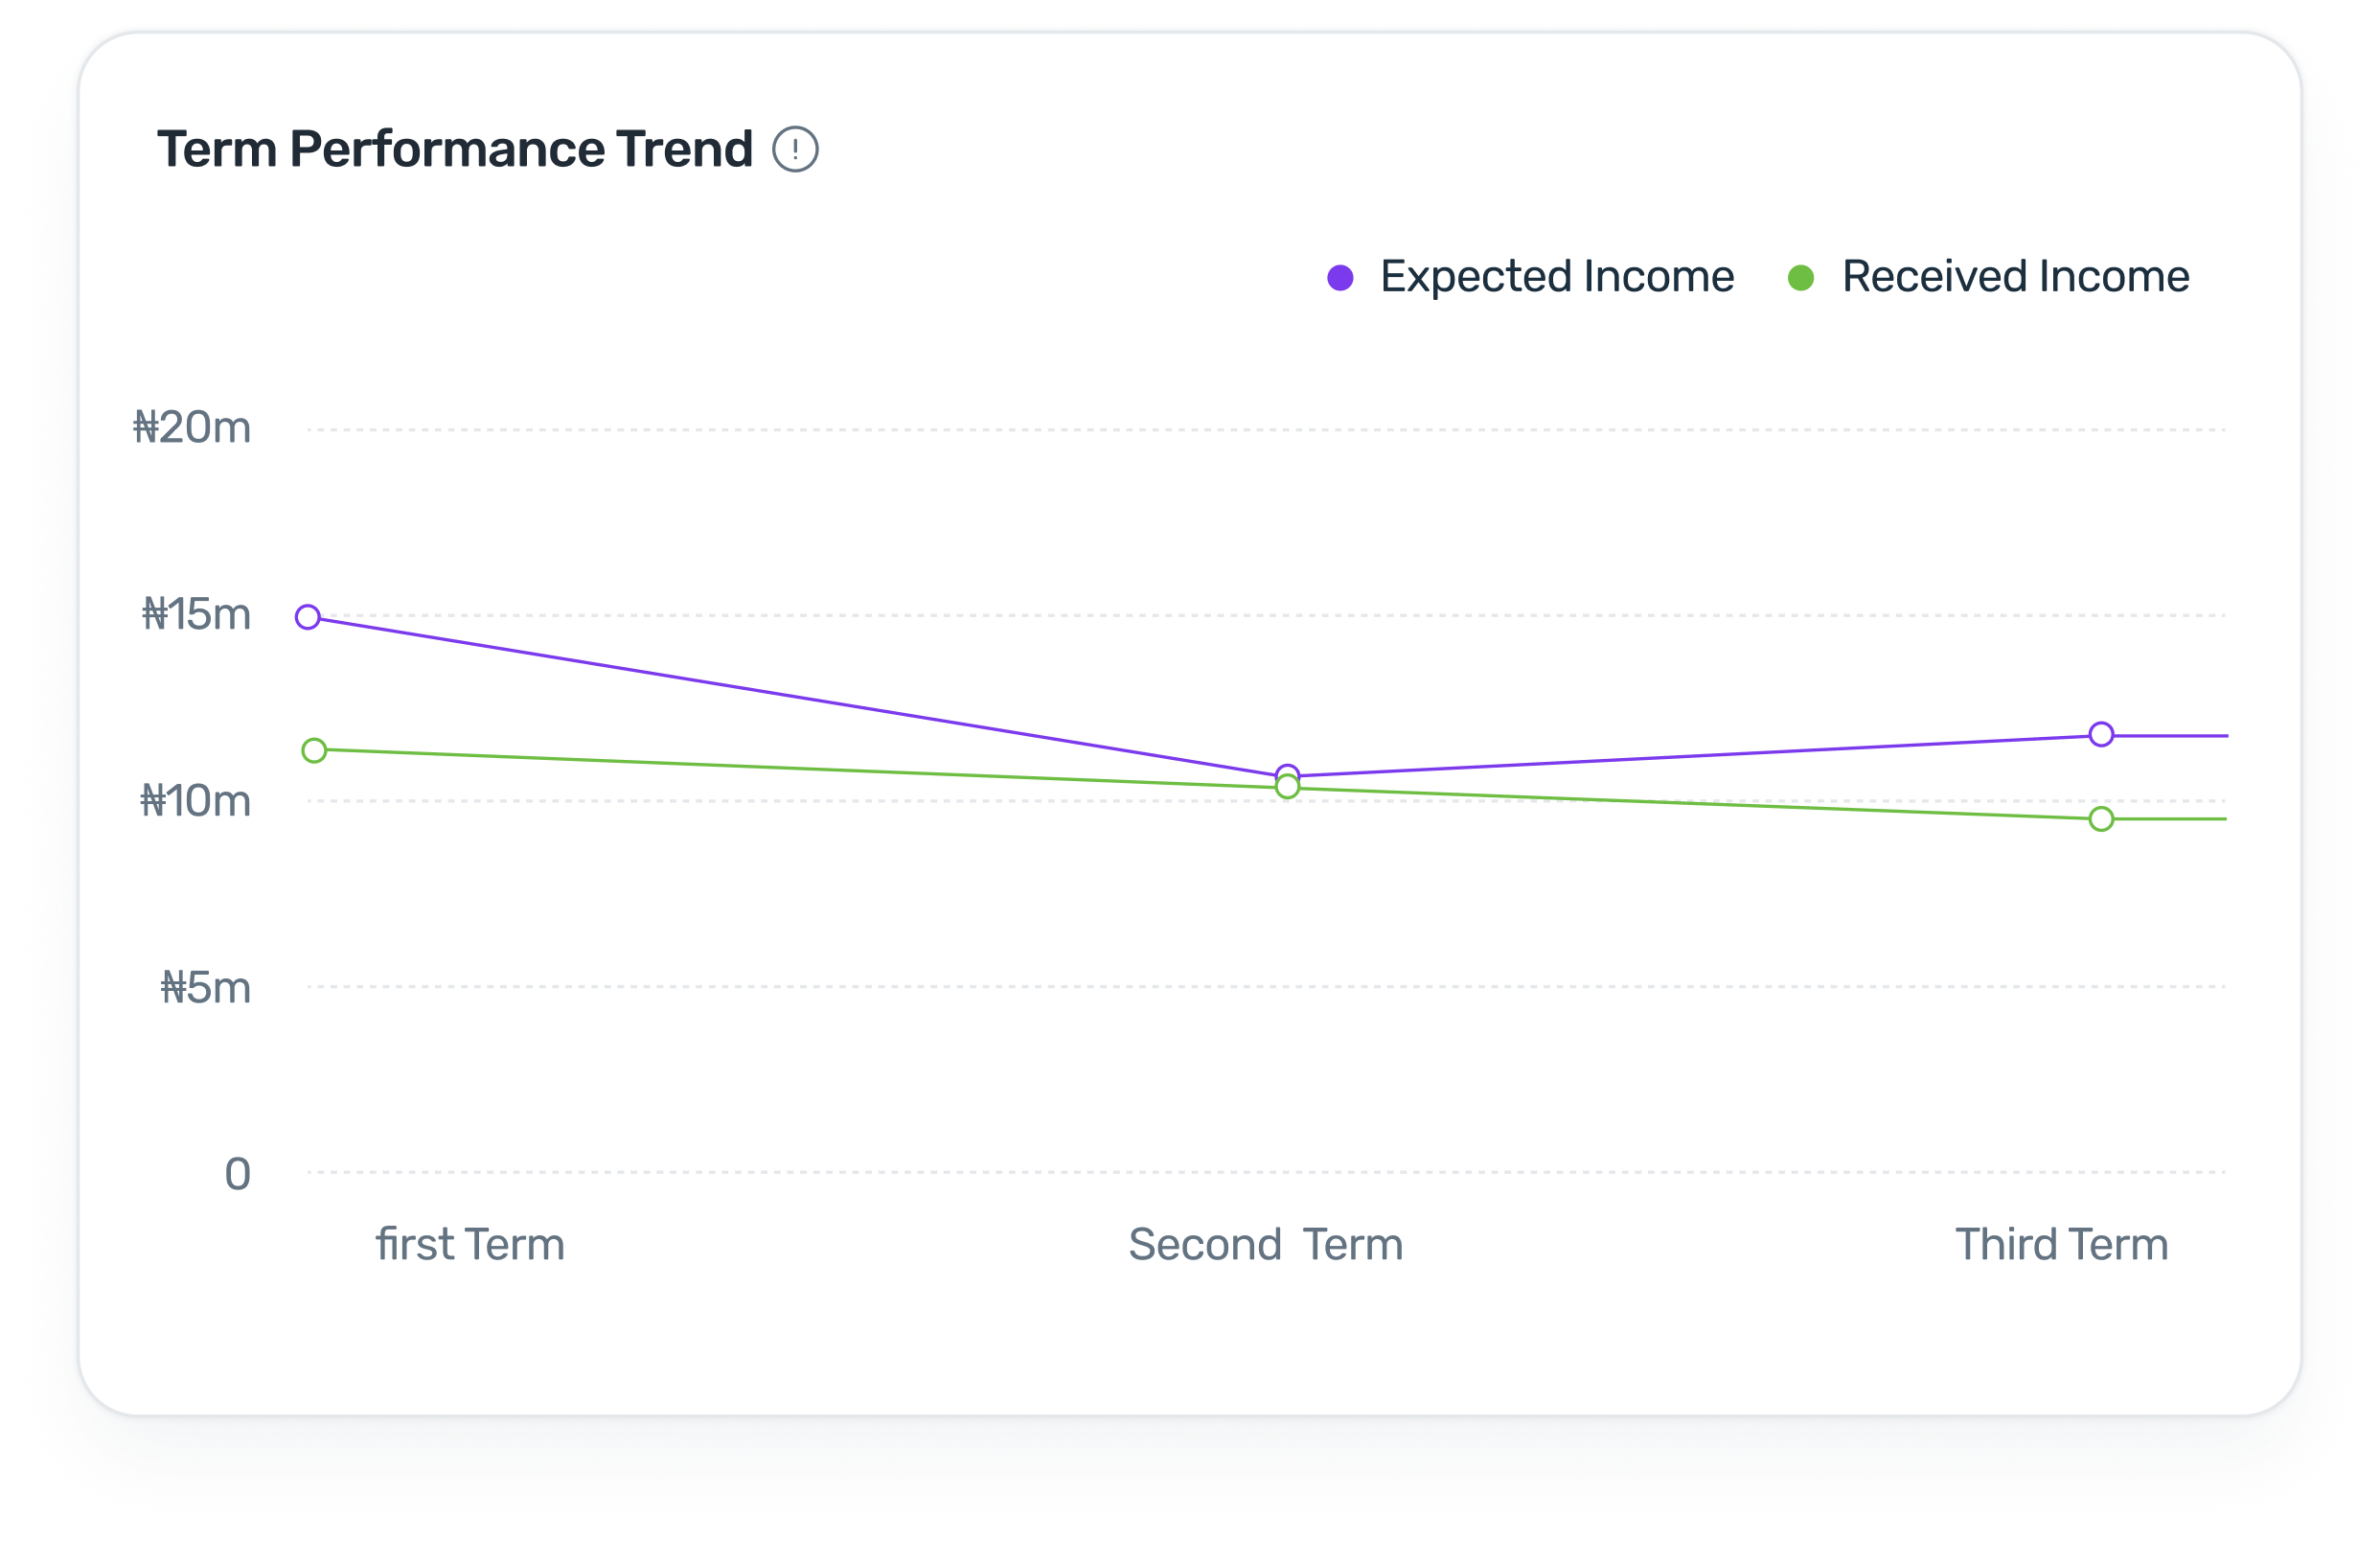
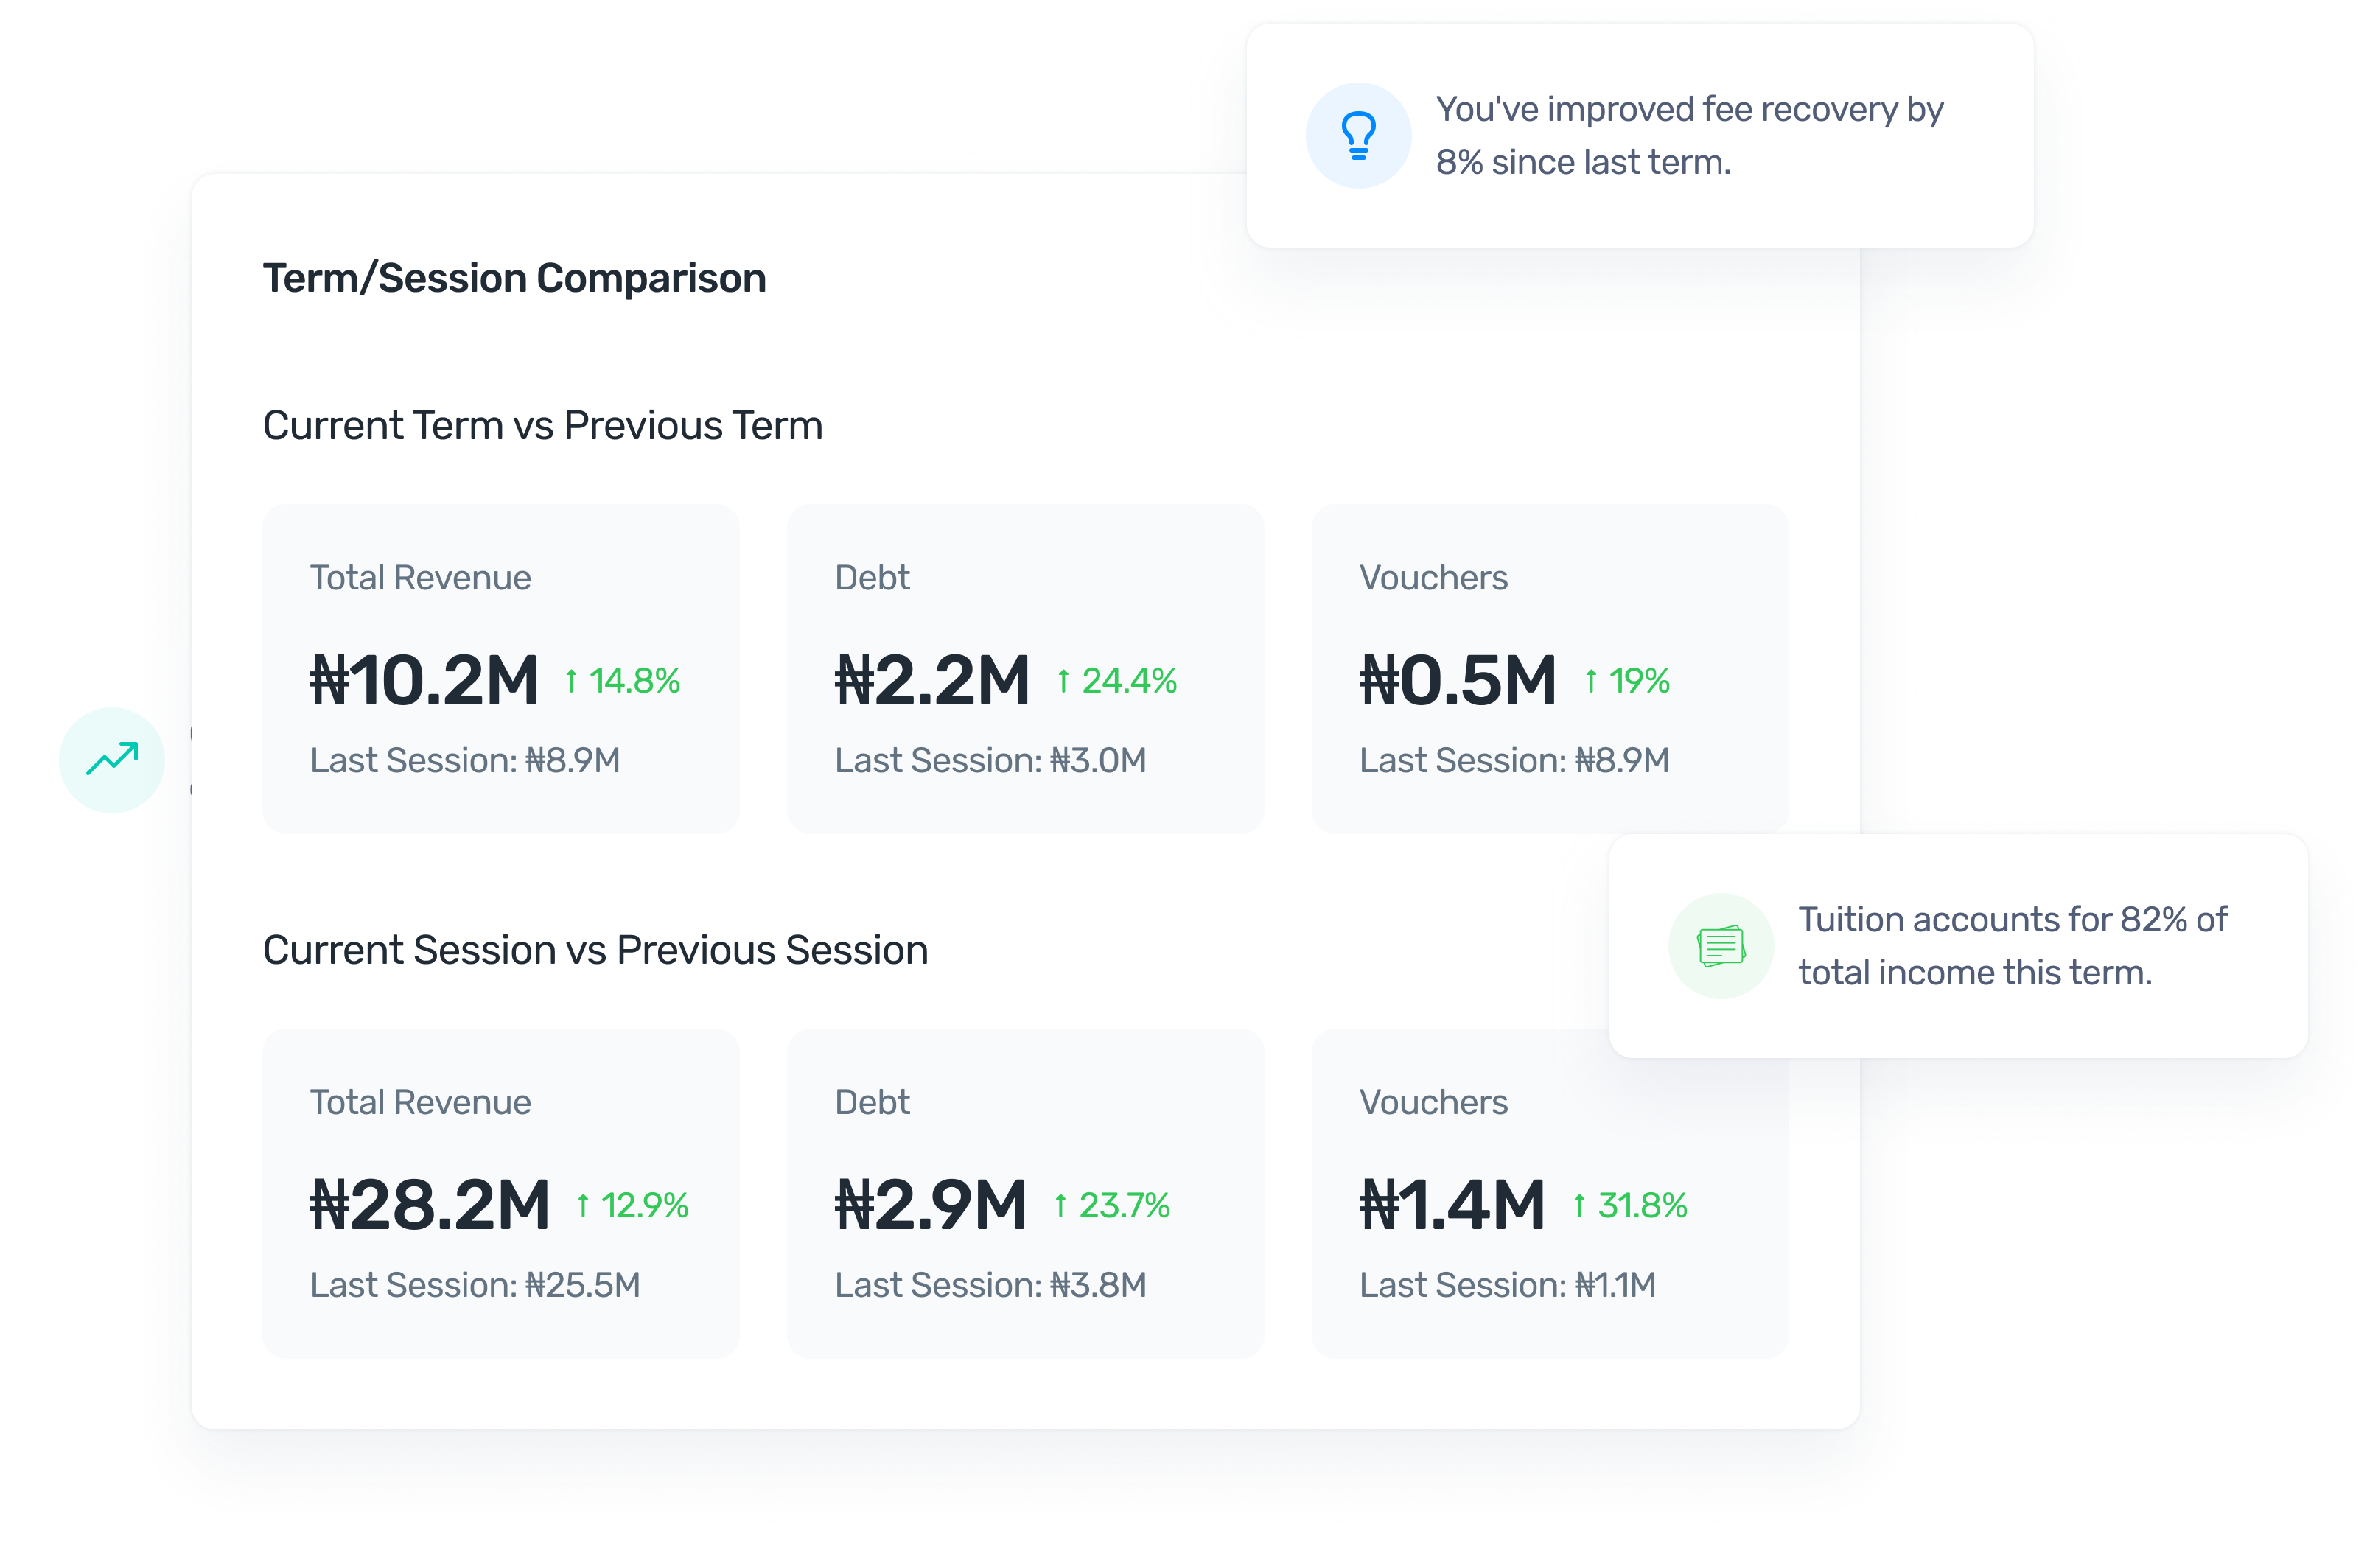
FundTrak tracks income and outstanding amounts across terms and sessions. Compare this term's collection rate to last term's — by class, by arm, or school-wide. When a pattern emerges, you'll see it in the data before it shows up in the bank account.
- Compare this term to last term — and to the same term last year
- View trends at school level, arm level, or individual class level
- Spot declining collection rates before they become a problem
- Income vs outstanding vs vouchers — all on one chart
Class-Level Detail
Zoom Into Performance — Class by Class
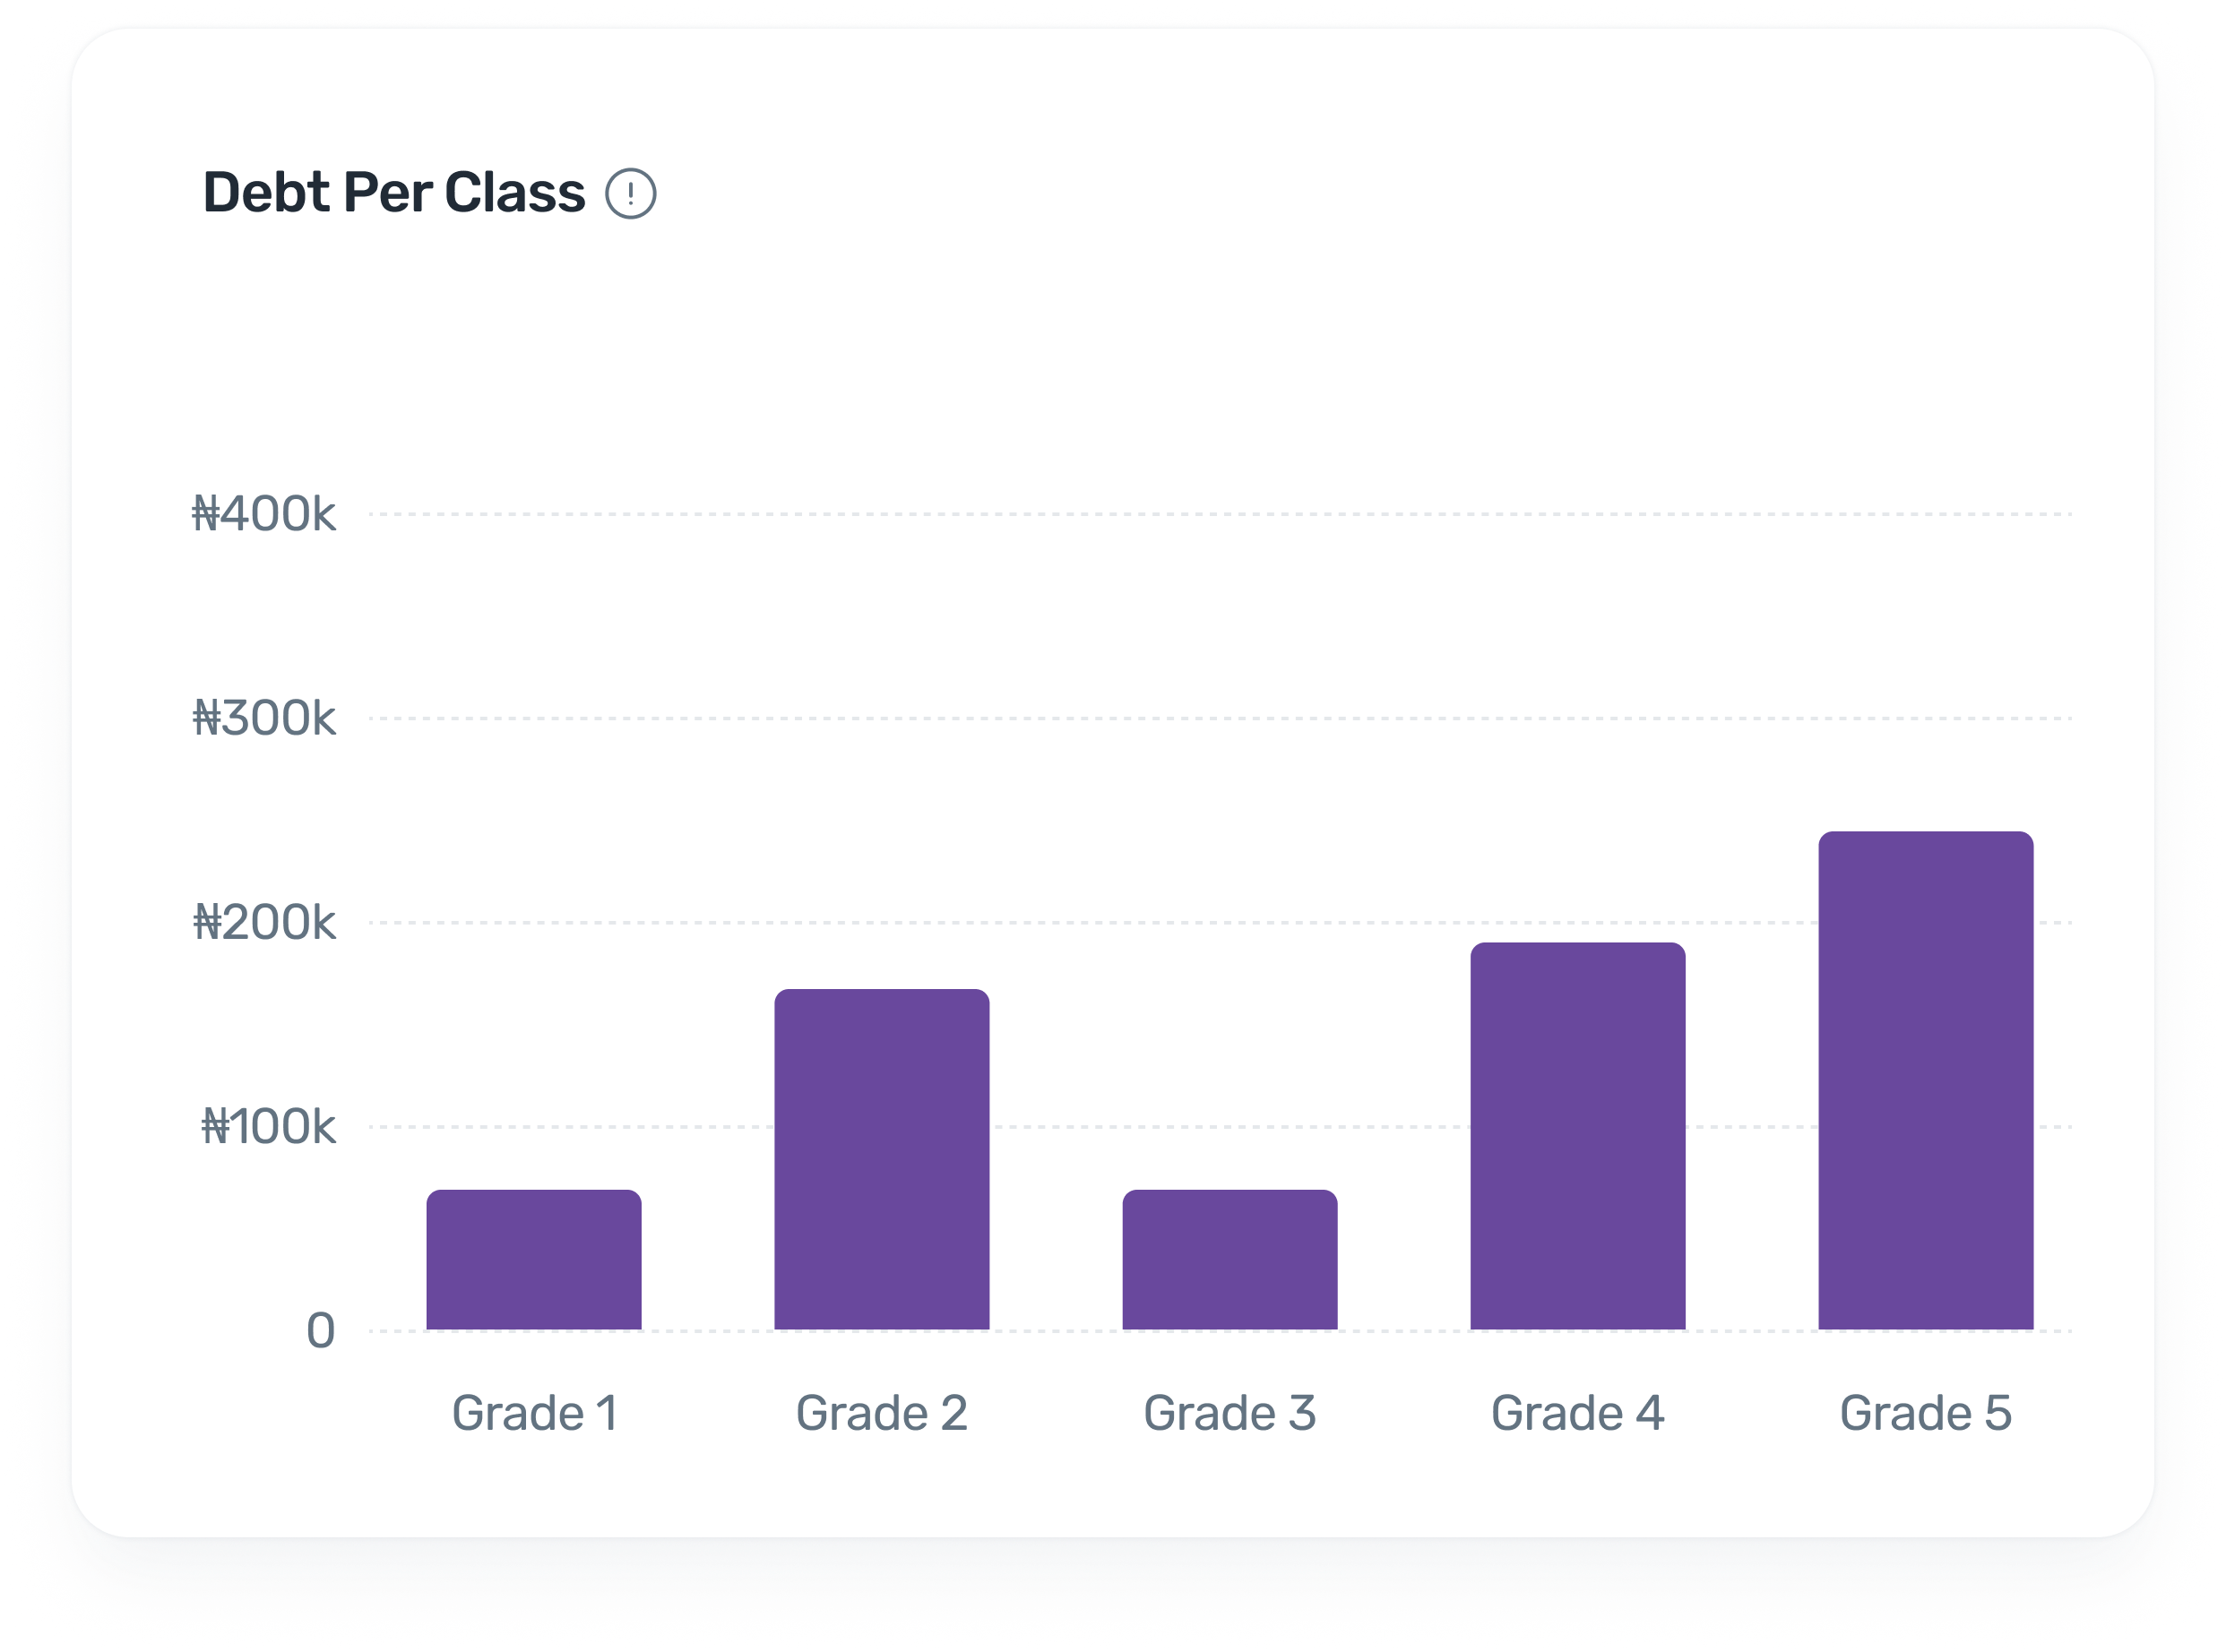
FundTrak breaks down every metric to the class level. See which classes are collecting well and which are falling behind. Track debt patterns per arm, per term, and per subscription — so you can act on specific problems instead of guessing at school-wide averages.
- Collection rate and outstanding amount per class — side by side
- Debt per class in current term and across terms
- Student count per subscription and per bracket category
- Debtors per subscription with last payment date tracking
Beyond dashboards
Exports, Scheduling, and Intelligence
PDF exports for any report, scheduled delivery, early warning alerts, and voucher analytics — tools that turn data into decisions.
PDF Export
Export any report as PDF — debtors lists, transaction statements, payment receipts, and financial summaries. Filter first, then download. Ready for board meetings, auditors, or parent inquiries.
Scheduled Reports
Automated weekly digests, monthly reports, and term-end summaries — delivered to your inbox on schedule. No manual generation. The right report at the right time.
Early Warning System
AI-powered risk scoring for at-risk students based on attendance patterns and payment behaviour. Anomaly detection flags unusual patterns. Health scores per school for multi-branch operators.
Voucher Analytics
Track voucher issuance by type, usage rates, remaining balances, and the impact of discounts on total income. See how much revenue is offset by scholarships and waivers.
Session & Term Filtering
Every report filters by academic session and term. Compare first term to third term, or this year to last year. Drill down into any time period without leaving the dashboard.
Academic Overview
High-level snapshot of your school's academic structure — total sessions, active terms, student counts per bracket, and enrolment distribution. The starting point for any admin review.
Stop guessing. Start seeing your school's financial reality.
Every report is live, every number is accurate, and every export is one click away.